📖 Debugger in Jupyterlab#
JupyterLab ships with a Debugger front-end by default.
Usage#
Here is a screencast showing how to enable the debugger and set up breakpoints. The steps are described in detail below.
Use a Kernel Supporting Debugger#
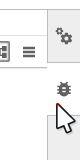
First, check that the kernel supports debugging. If it does, the bug icon in the upper-right corner of the notebook will be enabled.

Debug Code in Notebook#
To enable the debugger for a notebook, toggle the bug button in the upper-right corner of the notebook:

Once debugging is enabled, you can set breakpoints and step into the code.
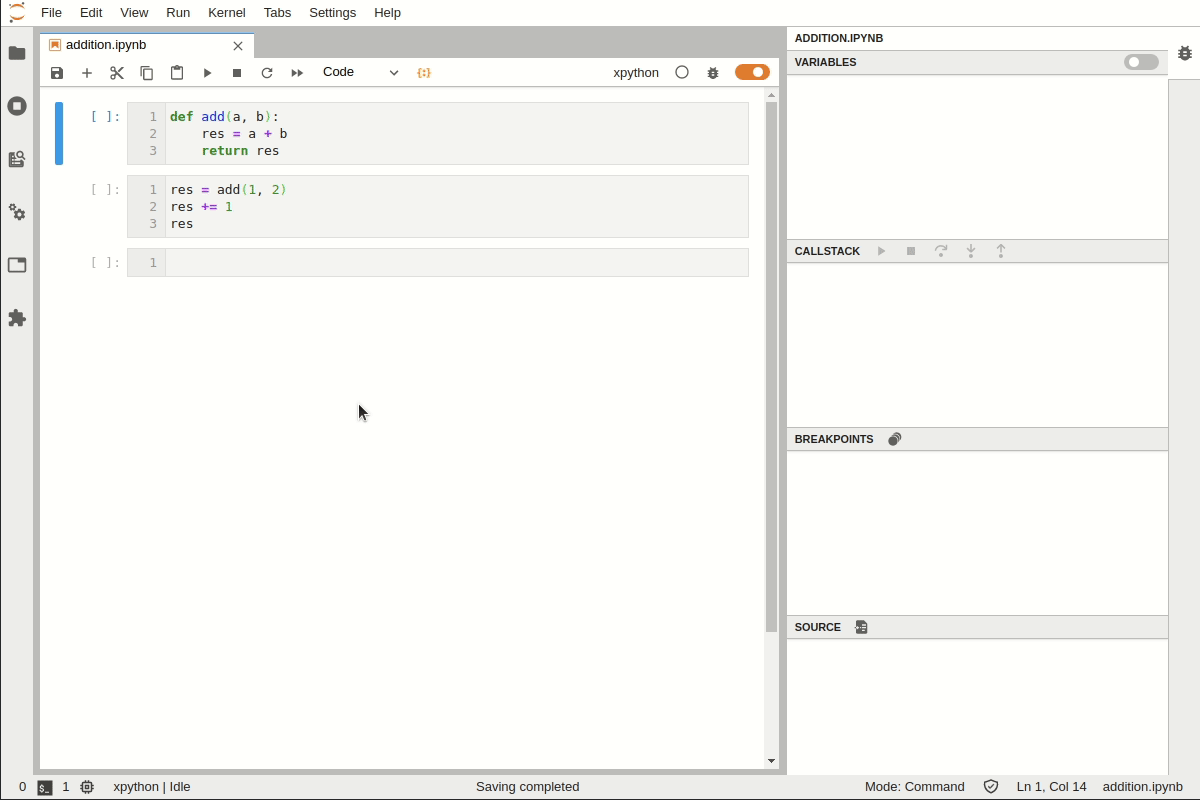
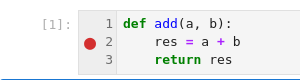
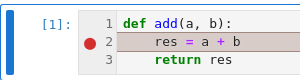
Define a function that adds two elements:
def add(a, b):
   res = a + b
   return res
Call the function and print the result:
result = add(1, 2)
print(result)
3
To add a breakpoint, click on the gutter on line number 2 in the first code cell:
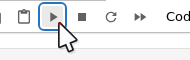
Execute the second code cell by clicking on the Run button:
Execution will stop where the breakpoint is set:
Explore the Code State#
The debugger sidebar allows you to explore the code state. It includes a variable explorer, a list of breakpoints, a source preview, and the ability to navigate the call stack.
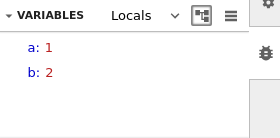
Variables#
Variables can be explored using a tree view and a table view:
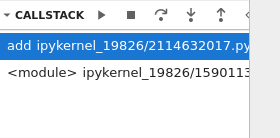
Call Stack#
You can step into the code and continue execution using debug actions:
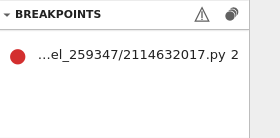
Breakpoints#
New breakpoints can be added or removed while execution is stopped. They will appear in the list of breakpoints:
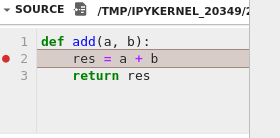
Source#
The source panel shows the source of the current file being debugged: