
📝 🎨 Image Analysis in Python#
“Images aren’t just pretty pictures—they’re data, and we’re going to treat them like the engineers we are! Buckle up, because we’re diving into pixels, matrices, and a dash of fun! 🎢
“An image is worth a million data points!” – Probably some engineer
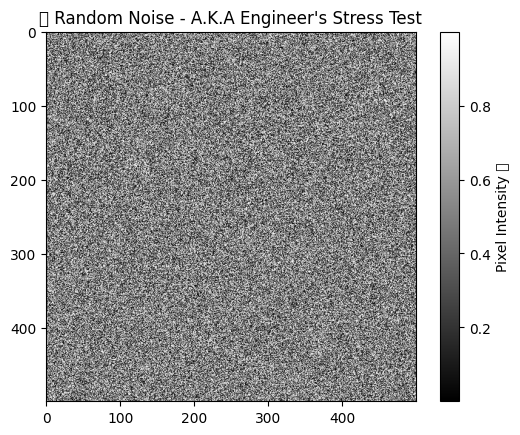
🎲 Building a Random Grayscale Image#
Who needs real images when we can create chaos? Let’s make some engineering noise (literally)!
import numpy as np

# Builds a random numpy array (aka engineering noise simulator)
random_image = np.random.random([500, 500])
import matplotlib.pyplot as plt

# plots the numpy array
plt.imshow(random_image, cmap="gray")
plt.title("🎲 Random Noise - A.K.A Engineer's Stress Test")
plt.colorbar(label="Pixel Intensity 📏")
plt.show()
/home/jca92/drexel_runner_engineering/actions-runner/_work/_tool/Python/3.11.11/x64/lib/python3.11/site-packages/IPython/core/pylabtools.py:170: UserWarning: Glyph 127922 (\N{GAME DIE}) missing from font(s) DejaVu Sans.
  fig.canvas.print_figure(bytes_io, **kw)
/home/jca92/drexel_runner_engineering/actions-runner/_work/_tool/Python/3.11.11/x64/lib/python3.11/site-packages/IPython/core/pylabtools.py:170: UserWarning: Glyph 128207 (\N{STRAIGHT RULER}) missing from font(s) DejaVu Sans.
  fig.canvas.print_figure(bytes_io, **kw)
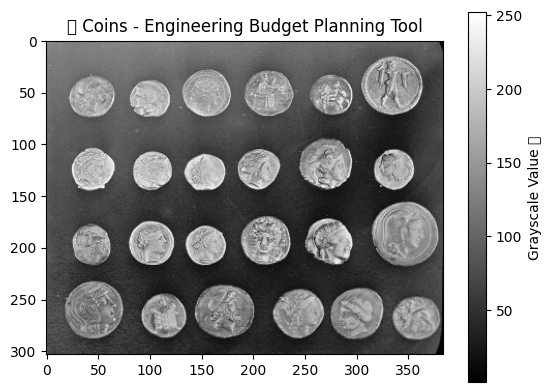
🪙 Real World Images – Coin Identification!#
Because sometimes engineers just need to know if the vending machine will accept their change… 🍫
from skimage import data

# imports a coins image
coins = data.coins()
# displays information about the data
print("🧾 Type:", type(coins))
print("📏 Dtype:", coins.dtype)
print("📐 Shape:", coins.shape)
🧾 Type: <class 'numpy.ndarray'>
📏 Dtype: uint8
📐 Shape: (303, 384)
# plots the data
plt.imshow(coins, cmap="gray")
plt.title("🪙 Coins - Engineering Budget Planning Tool")
plt.colorbar(label="Grayscale Value 💰")
plt.show()
/home/jca92/drexel_runner_engineering/actions-runner/_work/_tool/Python/3.11.11/x64/lib/python3.11/site-packages/IPython/core/pylabtools.py:170: UserWarning: Glyph 129689 (\N{COIN}) missing from font(s) DejaVu Sans.
  fig.canvas.print_figure(bytes_io, **kw)
/home/jca92/drexel_runner_engineering/actions-runner/_work/_tool/Python/3.11.11/x64/lib/python3.11/site-packages/IPython/core/pylabtools.py:170: UserWarning: Glyph 128176 (\N{MONEY BAG}) missing from font(s) DejaVu Sans.
  fig.canvas.print_figure(bytes_io, **kw)
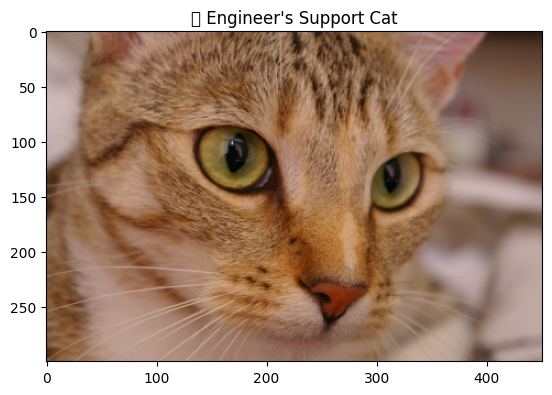
🎨 Color Images – Because Engineers Need RGB too!#
Let’s check out a colorful kitty—great for testing RGB channels and distracting ourselves from debugging.
# collects the cat data
cat = data.chelsea()

print("🖼️ Shape:", cat.shape)
print("🎨 Values min/max:", cat.min(), cat.max())

plt.imshow(cat)
plt.title("🐾 Engineer's Support Cat")
plt.show()
🖼️ Shape: (300, 451, 3)
🎨 Values min/max: 0 231
/home/jca92/drexel_runner_engineering/actions-runner/_work/_tool/Python/3.11.11/x64/lib/python3.11/site-packages/IPython/core/pylabtools.py:170: UserWarning: Glyph 128062 (\N{PAW PRINTS}) missing from font(s) DejaVu Sans.
  fig.canvas.print_figure(bytes_io, **kw)
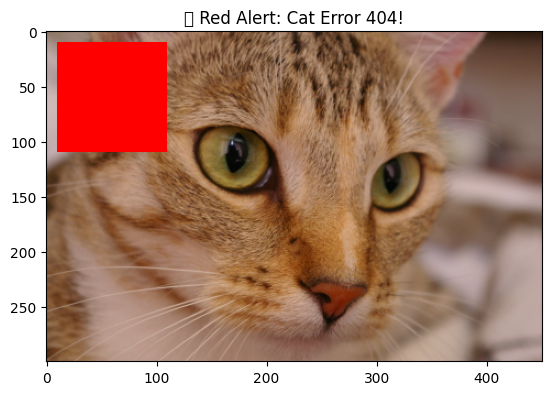
🟥 Let’s Engineer a Red Alert!#
Using NumPy array slicing like a true engineer. Let’s paint a red square to simulate a “critical error” (or just for fun). 🚨
# replaces values to be red by indexing the image
cat[10:110, 10:110, :] = [255, 0, 0]  # [red, green, blue]

plt.imshow(cat)
plt.title("🚨 Red Alert: Cat Error 404!")
plt.show()
/home/jca92/drexel_runner_engineering/actions-runner/_work/_tool/Python/3.11.11/x64/lib/python3.11/site-packages/IPython/core/pylabtools.py:170: UserWarning: Glyph 128680 (\N{POLICE CARS REVOLVING LIGHT}) missing from font(s) DejaVu Sans.
  fig.canvas.print_figure(bytes_io, **kw)
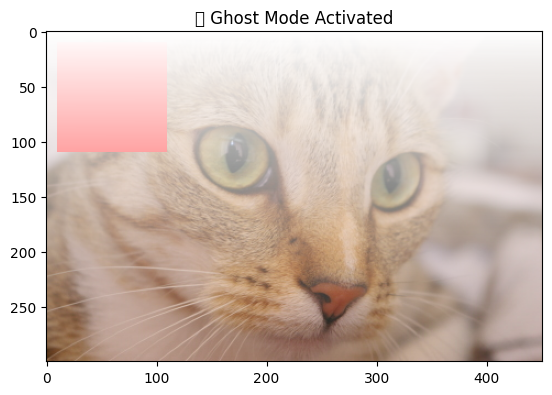
🎭 Playing with Transparency – Engineering Ghost Mode#
Add an alpha channel and make the cat fade like your motivation during debugging.
# creates a continuous gradient
alpha = np.arange(135300).reshape(cat.shape[0:2]) / 135300
alpha *= 255
# Adds the alpha channel
image = np.dstack((cat, alpha.astype("uint8")))

plt.imshow(image)
plt.title("👻 Ghost Mode Activated")
plt.show()
/home/jca92/drexel_runner_engineering/actions-runner/_work/_tool/Python/3.11.11/x64/lib/python3.11/site-packages/IPython/core/pylabtools.py:170: UserWarning: Glyph 128123 (\N{GHOST}) missing from font(s) DejaVu Sans.
  fig.canvas.print_figure(bytes_io, **kw)
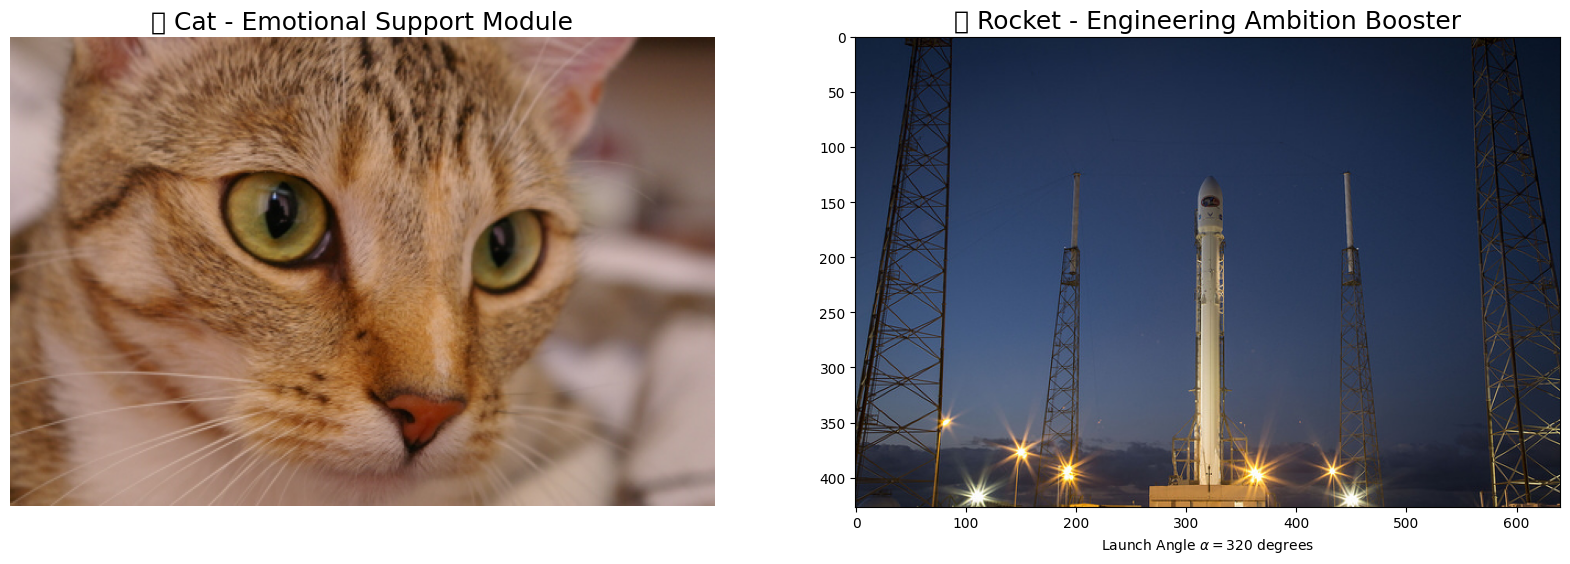
🔍 Image Comparisons – Cat vs Rocket#
Because engineers always compare things. Let’s see a cat vs rocket showdown!
# Loads data from Skimage
img0 = data.chelsea()
img1 = data.rocket()
import matplotlib.pyplot as plt

# Creates the subplot
f, (ax0, ax1) = plt.subplots(1, 2, figsize=(20, 10))

# Plots the cat image
ax0.imshow(img0)
ax0.set_title("🐾 Cat - Emotional Support Module", fontsize=18)
ax0.axis("off")

# plots the rocket image
ax1.imshow(img1)
ax1.set_title("🚀 Rocket - Engineering Ambition Booster", fontsize=18)
ax1.set_xlabel(r"Launch Angle $\alpha=320$ degrees")
Text(0.5, 0, 'Launch Angle $\\alpha=320$ degrees')
/home/jca92/drexel_runner_engineering/actions-runner/_work/_tool/Python/3.11.11/x64/lib/python3.11/site-packages/IPython/core/events.py:82: UserWarning: Glyph 128062 (\N{PAW PRINTS}) missing from font(s) DejaVu Sans.
  func(*args, **kwargs)
/home/jca92/drexel_runner_engineering/actions-runner/_work/_tool/Python/3.11.11/x64/lib/python3.11/site-packages/IPython/core/events.py:82: UserWarning: Glyph 128640 (\N{ROCKET}) missing from font(s) DejaVu Sans.
  func(*args, **kwargs)
/home/jca92/drexel_runner_engineering/actions-runner/_work/_tool/Python/3.11.11/x64/lib/python3.11/site-packages/IPython/core/pylabtools.py:170: UserWarning: Glyph 128062 (\N{PAW PRINTS}) missing from font(s) DejaVu Sans.
  fig.canvas.print_figure(bytes_io, **kw)
/home/jca92/drexel_runner_engineering/actions-runner/_work/_tool/Python/3.11.11/x64/lib/python3.11/site-packages/IPython/core/pylabtools.py:170: UserWarning: Glyph 128640 (\N{ROCKET}) missing from font(s) DejaVu Sans.
  fig.canvas.print_figure(bytes_io, **kw)
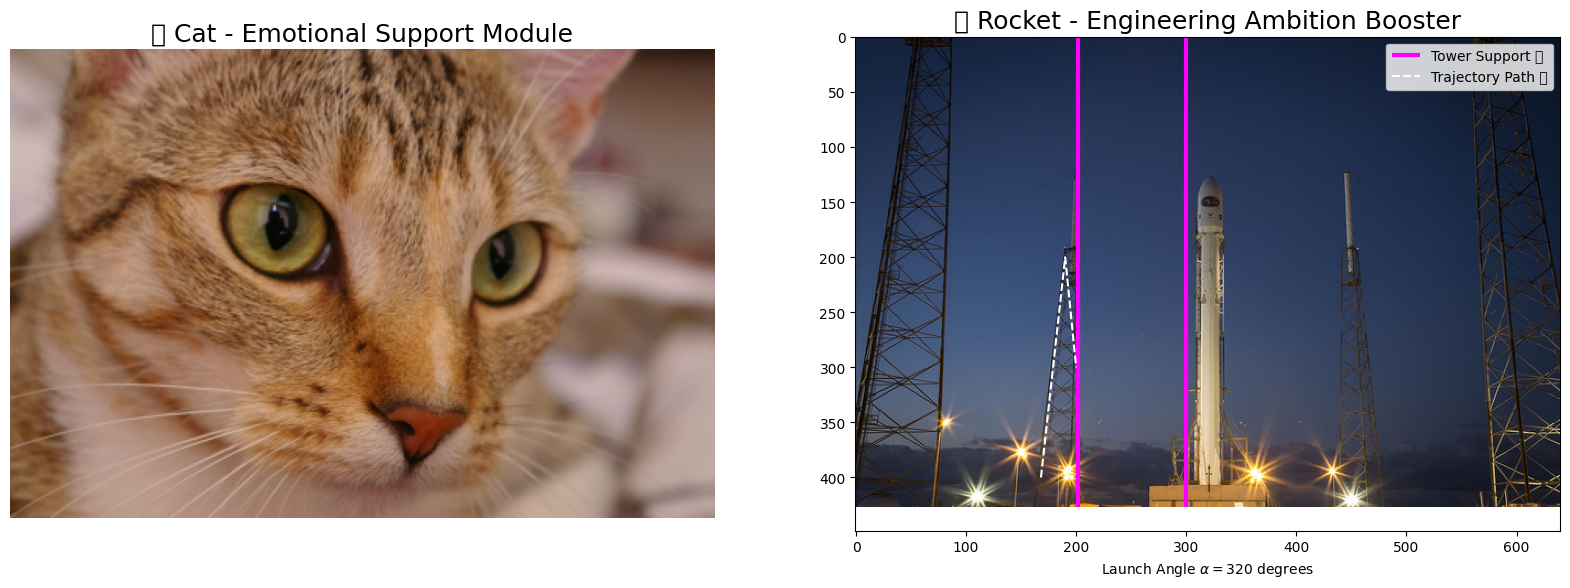
import matplotlib.pyplot as plt

# Creates the subplot
f, (ax0, ax1) = plt.subplots(1, 2, figsize=(20, 10))

# Plots the cat image
ax0.imshow(img0)
ax0.set_title("🐾 Cat - Emotional Support Module", fontsize=18)
ax0.axis("off")

# plots the rocket image
ax1.imshow(img1)
ax1.set_title("🚀 Rocket - Engineering Ambition Booster", fontsize=18)
ax1.set_xlabel(r"Launch Angle $\alpha=320$ degrees")


# plots a vertical line on the rocket image
ax1.vlines(
    [202, 300],
    0,
    img1.shape[0],
    colors="magenta",
    linewidth=3,
    label="Tower Support 🚧",
)

# plots a line plot on the rocket image
ax1.plot(
    [168, 190, 200],
    [400, 200, 300],
    color="white",
    linestyle="--",
    label="Trajectory Path 📈",
)

# adds the legend
ax1.legend()

plt.show()
/home/jca92/drexel_runner_engineering/actions-runner/_work/_tool/Python/3.11.11/x64/lib/python3.11/site-packages/IPython/core/pylabtools.py:170: UserWarning: Glyph 128679 (\N{CONSTRUCTION SIGN}) missing from font(s) DejaVu Sans.
  fig.canvas.print_figure(bytes_io, **kw)
/home/jca92/drexel_runner_engineering/actions-runner/_work/_tool/Python/3.11.11/x64/lib/python3.11/site-packages/IPython/core/pylabtools.py:170: UserWarning: Glyph 128200 (\N{CHART WITH UPWARDS TREND}) missing from font(s) DejaVu Sans.
  fig.canvas.print_figure(bytes_io, **kw)
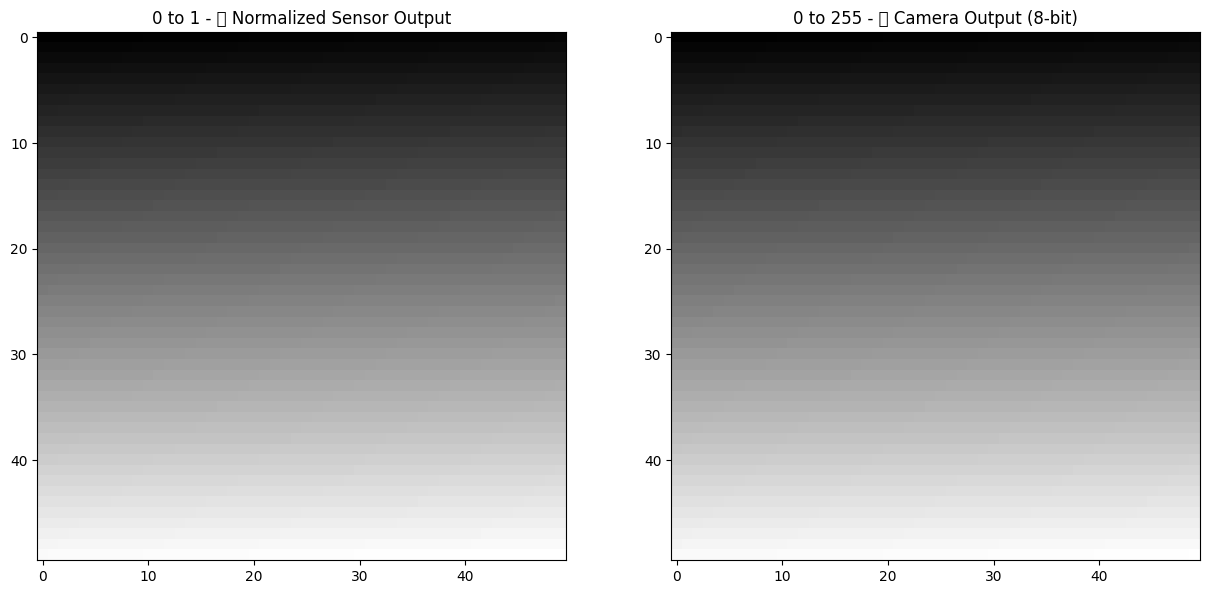
⚙️ Engineering Data Types and Image Values#
Just like with sensors, image data needs proper units! Let’s engineer some examples:
# defines two linear spaced vectors, one from 0 to 1, one from 0 to 255.
linear0 = np.linspace(0, 1, 2500).reshape((50, 50))
linear1 = np.linspace(0, 255, 2500).reshape((50, 50)).astype(np.uint8)

# prints the information about the data
print("🔢 Linear0:", linear0.dtype, linear0.min(), linear0.max())
print("🔢 Linear1:", linear1.dtype, linear1.min(), linear1.max())

# plots the data
fig, (ax0, ax1) = plt.subplots(1, 2, figsize=(15, 15))
ax0.imshow(linear0, cmap="gray")
ax0.set_title("0 to 1 - 🧪 Normalized Sensor Output")
ax1.imshow(linear1, cmap="gray")
ax1.set_title("0 to 255 - 📸 Camera Output (8-bit)")
plt.show()
🔢 Linear0: float64 0.0 1.0
🔢 Linear1: uint8 0 255
/home/jca92/drexel_runner_engineering/actions-runner/_work/_tool/Python/3.11.11/x64/lib/python3.11/site-packages/IPython/core/pylabtools.py:170: UserWarning: Glyph 129514 (\N{TEST TUBE}) missing from font(s) DejaVu Sans.
  fig.canvas.print_figure(bytes_io, **kw)
/home/jca92/drexel_runner_engineering/actions-runner/_work/_tool/Python/3.11.11/x64/lib/python3.11/site-packages/IPython/core/pylabtools.py:170: UserWarning: Glyph 128248 (\N{CAMERA WITH FLASH}) missing from font(s) DejaVu Sans.
  fig.canvas.print_figure(bytes_io, **kw)
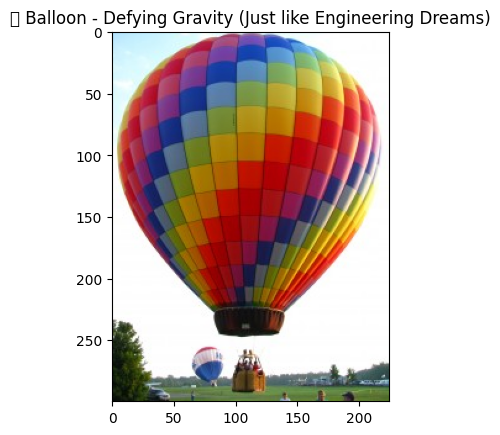
📸 Loading Real World Images – Engineering Input Data#
No more built-in samples, let’s load custom images like real engineers do.
from skimage import io

# reads the balloon image
image = io.imread("./assets/figures/balloon.jpg")

# prints information about the balloon image array
print("🖼️ Type:", type(image))
print("🎨 Dtype:", image.dtype)
print("📏 Shape:", image.shape)
print("📉 Min/Max:", image.min(), image.max())

plt.imshow(image)
plt.title("🎈 Balloon - Defying Gravity (Just like Engineering Dreams)")
plt.show()
🖼️ Type: <class 'numpy.ndarray'>
🎨 Dtype: uint8
📏 Shape: (300, 225, 3)
📉 Min/Max: 0 255
/home/jca92/drexel_runner_engineering/actions-runner/_work/_tool/Python/3.11.11/x64/lib/python3.11/site-packages/IPython/core/pylabtools.py:170: UserWarning: Glyph 127880 (\N{BALLOON}) missing from font(s) DejaVu Sans.
  fig.canvas.print_figure(bytes_io, **kw)
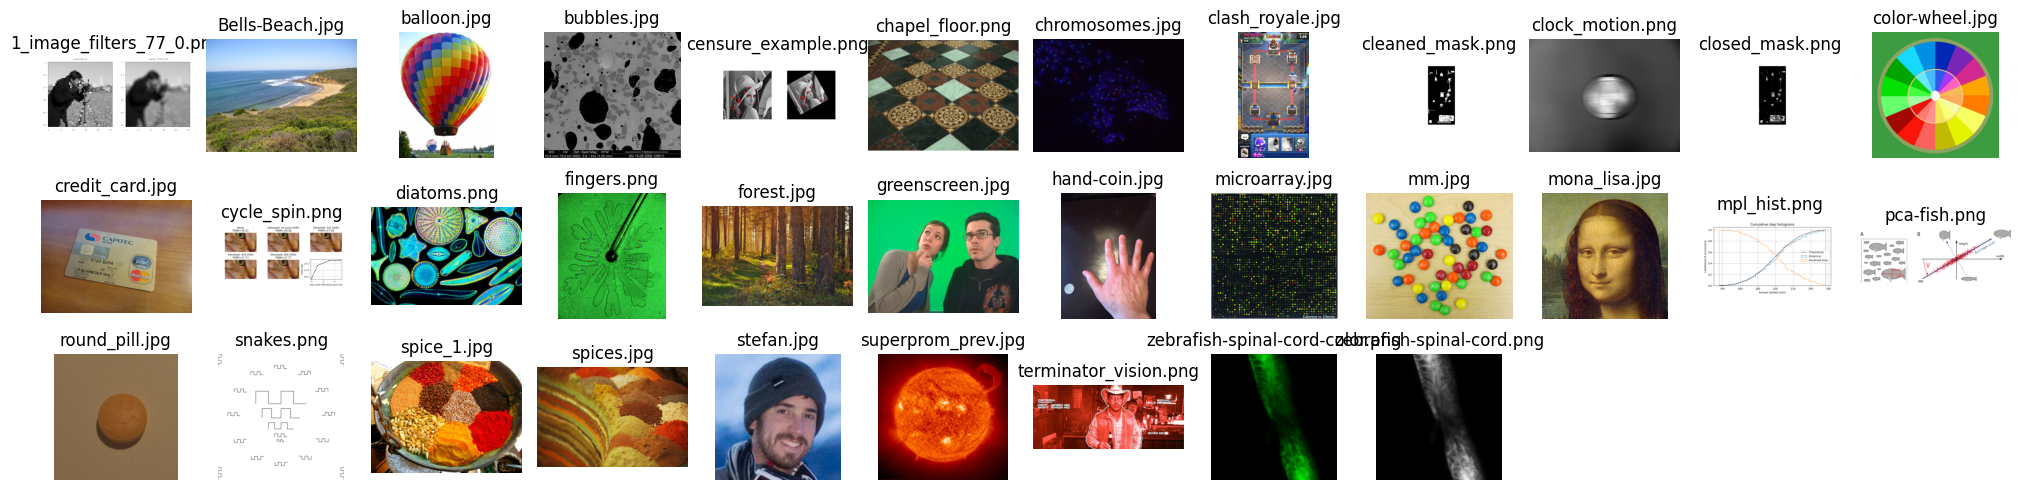
🎥 Multiple Images – Engineering Data Pipelines#
Let’s read multiple images because no experiment ever uses just one data point!
from skimage import io
import matplotlib.pyplot as plt
import os

# Reads a folder of images
# the * is a wildcard operator that takes all that match that description
ic = io.imread_collection(["./assets/figures/*.jpg", "./assets/figures/*.png"])

# prints what the ic object is
print("📂 Type:", type(ic))

# shows the list of files
print("📁 Files:", ic.files)

# This is one of the many ways to make subplots
# subplots returns the figure and an array of axes
f, axes = plt.subplots(nrows=3, ncols=len(ic) // 3 + 1, figsize=(20, 5))

# we use `axes.ravel()` to turn these into a list
axes = axes.ravel()

# turns all of the axis off
for ax in axes:
    ax.axis("off")

# plots all of the images in the collection
for i, image in enumerate(ic):
    axes[i].imshow(image, cmap="gray")
    axes[i].set_title(os.path.basename(ic.files[i]))

# This cleans the layout of the image
plt.tight_layout()
plt.show()
📂 Type: <class 'skimage.io.collection.ImageCollection'>
📁 Files: ['./assets/figures/1_image_filters_77_0.png', './assets/figures/Bells-Beach.jpg', './assets/figures/balloon.jpg', './assets/figures/bubbles.jpg', './assets/figures/censure_example.png', './assets/figures/chapel_floor.png', './assets/figures/chromosomes.jpg', './assets/figures/clash_royale.jpg', './assets/figures/cleaned_mask.png', './assets/figures/clock_motion.png', './assets/figures/closed_mask.png', './assets/figures/color-wheel.jpg', './assets/figures/credit_card.jpg', './assets/figures/cycle_spin.png', './assets/figures/diatoms.png', './assets/figures/fingers.png', './assets/figures/forest.jpg', './assets/figures/greenscreen.jpg', './assets/figures/hand-coin.jpg', './assets/figures/microarray.jpg', './assets/figures/mm.jpg', './assets/figures/mona_lisa.jpg', './assets/figures/mpl_hist.png', './assets/figures/pca-fish.png', './assets/figures/round_pill.jpg', './assets/figures/snakes.png', './assets/figures/spice_1.jpg', './assets/figures/spices.jpg', './assets/figures/stefan.jpg', './assets/figures/superprom_prev.jpg', './assets/figures/terminator_vision.png', './assets/figures/zebrafish-spinal-cord-color.png', './assets/figures/zebrafish-spinal-cord.png']
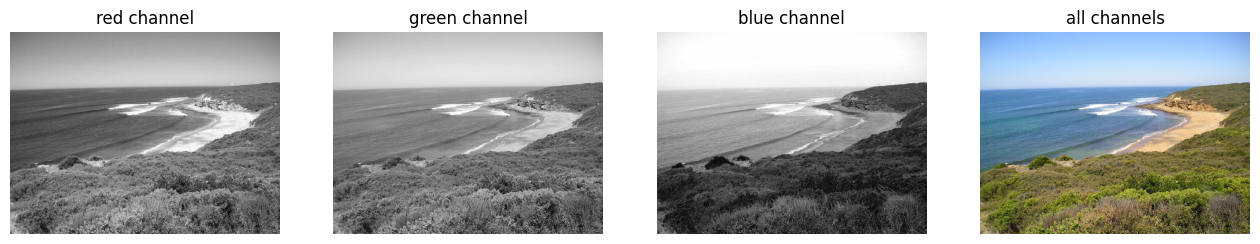
🎨 Color Images – Engineering Data Pipelines#
# --- read in the image ---
image = plt.imread("./assets/figures/Bells-Beach.jpg")

# --- assign each color channel to a different variable ---

r = image[..., 0]
g = image[..., 1]
b = image[..., 2]

# --- display the image and r, g, b channels ---

f, axes = plt.subplots(1, 4, figsize=(16, 5))

for ax in axes:
    ax.axis("off")

(ax_r, ax_g, ax_b, ax_color) = axes

ax_r.imshow(r, cmap="gray")
ax_r.set_title("red channel")

ax_g.imshow(g, cmap="gray")
ax_g.set_title("green channel")

ax_b.imshow(b, cmap="gray")
ax_b.set_title("blue channel")

# --- Here, we stack the R, G, and B layers again
#     to form a color image ---
ax_color.imshow(np.stack([r, g, b], axis=2))
ax_color.set_title("all channels")
Text(0.5, 1.0, 'all channels')
Visualizing Color Channels#
from skimage import segmentation, morphology, draw

# builds 3 zero arrays
red = np.zeros((300, 300))
green = np.zeros((300, 300))
blue = np.zeros((300, 300))

# draws some circles with different positions
r, c = draw.disk((100, 100), 100)
red[r, c] = 1

r, c = draw.disk((100, 200), 100)
green[r, c] = 1

r, c = draw.disk((200, 150), 100)
blue[r, c] = 1

stacked = np.stack([red, green, blue], axis=2)

# plots the individual channels as binary images
f, axes = plt.subplots(1, 4)
for ax, channel in zip(axes, [red, green, blue, stacked]):
    ax.imshow(channel, cmap="gray")
    ax.axis("off")

🛠️ And there you have it!#
You’ve just engineered your way through image manipulation using scikit-image and numpy! From creating chaos with random noise to loading custom images, you’re now an image processing pro!