
📖 🛠️ Python Engineer’s Toolbox: Essential Tools for Mathematical and Computational Engineering#

As an engineer or data scientist, having the right tools at your disposal is critical. Python, with its rich ecosystem of libraries, provides a “toolbox” to solve a wide range of mathematical and computational problems. Let’s dive into the most essential tools and explore their purpose in the context of engineering and applied mathematics.
🔧 1. NumPy: The Foundation for Numerical Computation#

Who: For engineers, scientists, and developers who need efficient numerical computation.
What: A library for numerical operations on large, multi-dimensional arrays and matrices, with a comprehensive collection of mathematical functions.
Where: Used in applications requiring fast linear algebra, matrix operations, and array manipulation.
When: Essential when solving problems involving numerical simulations, signal processing, or statistical computations.
Why: Optimized for speed through its use of low-level C and Fortran implementations, making it much faster than standard Python loops for numerical tasks.
Example:
import numpy as np

matrix = np.array([[1, 2], [3, 4]])
determinant = np.linalg.det(matrix)
print(f"Determinant: {determinant}")
Determinant: -2.0000000000000004
🛠️ 2. Pandas: The Data Analysis and Manipulation Tool#

Who: For engineers and researchers working with structured data (e.g., time series, experimental results).
What: A library offering high-performance, easy-to-use data structures (like DataFrames) for handling and analyzing data.
Where: Widely used in data cleaning, preparation, and exploratory data analysis (EDA).
When: Crucial when you need to process large datasets for statistical analysis or machine learning pipelines.
Why: Pandas provides high-level abstraction for data operations, enabling complex manipulations with minimal code.
Example:
import pandas as pd

data = {"Experiment": ["A", "B", "C"], "Result": [0.98, 0.75, 0.89]}
df = pd.DataFrame(data)
print(df.describe())  # Provides summary statistics
         Result
count  3.000000
mean   0.873333
std    0.115902
min    0.750000
25%    0.820000
50%    0.890000
75%    0.935000
max    0.980000
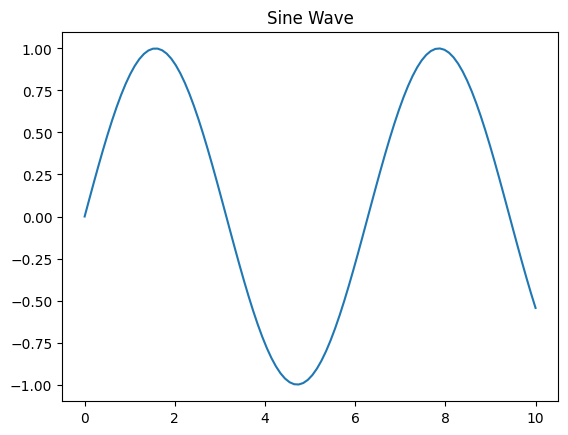
⚙️ 3. Matplotlib & Seaborn: Visualization Libraries#
![]()
![]()
Who: For professionals who need to visualize and interpret data.
What: Libraries for creating static, animated, and interactive plots.
Where: Used in research papers, presentations, and exploratory analysis to communicate results.
When: Vital when analyzing trends, distributions, or relationships in data.
Why: Visualizations help in understanding complex mathematical relationships and presenting them effectively.
Example:
import matplotlib.pyplot as plt
import numpy as np

x = np.linspace(0, 10, 100)
y = np.sin(x)
plt.plot(x, y)
plt.title("Sine Wave")
plt.show()
🧰 4. SciPy: The Scientific Computing Companion#
Who: For engineers and scientists solving problems in optimization, signal processing, and statistical analysis.
What: A library built on NumPy, providing advanced algorithms for optimization, integration, and differential equation solvers.
Where: In mathematical modeling, simulation, and real-world problem-solving across physics, engineering, and economics.
When: When basic NumPy functionalities are insufficient for your problem.
Why: SciPy’s specialized modules simplify complex numerical computations, making it an essential extension of NumPy.
Example:
from scipy.optimize import minimize

f = lambda x: (x - 3) ** 2
result = minimize(f, x0=0)
print(f"Minimum occurs at: {result.x}")
Minimum occurs at: [2.99999998]
📏 5. Scikit-learn: Machine Learning Made Accessible#
![]()
Who: For data scientists and engineers working on predictive modeling and classification tasks.
What: A comprehensive library for machine learning, including tools for classification, regression, clustering, and dimensionality reduction.
Where: Applied in projects requiring statistical learning models or predictive analytics.
When: Essential during feature engineering, model training, and evaluation stages.
Why: Scikit-learn abstracts complex algorithms into a simple and user-friendly interface, accelerating the development process.
Example:
from sklearn.linear_model import LinearRegression
import numpy as np

X = np.array([[1], [2], [3]])
y = np.array([2, 4, 6])
model = LinearRegression().fit(X, y)
print(f"Model Coefficient: {model.coef_}")
Model Coefficient: [2.]
🌐 6. SymPy: Symbolic Mathematics#
![]()
Who: For mathematicians, engineers, and scientists dealing with algebraic expressions and symbolic computations.
What: A Python library for performing symbolic mathematics, such as solving equations, simplifying expressions, or performing calculus.
Where: Used in engineering analyses, algorithm development, and education.
When: Essential when exact symbolic manipulation is required, such as deriving equations or solving systems symbolically.
Why: Automates tedious symbolic calculations, saving time and reducing errors.
Example:
from sympy import symbols, solve

x = symbols("x")
solution = solve(x**2 - 4, x)
print(f"Solutions: {solution}")
Solutions: [-2, 2]
🔬 7. Statsmodels: The Statistical Analysis Toolkit#
![]()
Who: For researchers, data analysts, and engineers performing statistical modeling and hypothesis testing.
What: A library for building statistical models, including regression analysis, time-series forecasting, and ANOVA.
Where: In fields like econometrics, biomedical research, and engineering quality control.
When: Vital for understanding relationships between variables and making statistical inferences.
Why: Statsmodels provides a rich suite of tools for applying rigorous statistical methods to real-world data.
Example:
import statsmodels.api as sm

X = [1, 2, 3, 4, 5]
y = [2, 4, 5, 4, 5]
X = sm.add_constant(X)  # Adds intercept term
model = sm.OLS(y, X).fit()
print(model.summary())
                            OLS Regression Results
==============================================================================
Dep. Variable:                      y   R-squared:                       0.600
Model:                            OLS   Adj. R-squared:                  0.467
Method:                 Least Squares   F-statistic:                     4.500
Date:                Tue, 11 Mar 2025   Prob (F-statistic):              0.124
Time:                        22:04:24   Log-Likelihood:                -5.2598
No. Observations:                   5   AIC:                             14.52
Df Residuals:                       3   BIC:                             13.74
Df Model:                           1
Covariance Type:            nonrobust
==============================================================================
                 coef    std err          t      P>|t|      [0.025      0.975]
------------------------------------------------------------------------------
const          2.2000      0.938      2.345      0.101      -0.785       5.185
x1             0.6000      0.283      2.121      0.124      -0.300       1.500
==============================================================================
Omnibus:                          nan   Durbin-Watson:                   2.017
Prob(Omnibus):                    nan   Jarque-Bera (JB):                0.570
Skew:                           0.289   Prob(JB):                        0.752
Kurtosis:                       1.450   Cond. No.                         8.37
==============================================================================

Notes:
[1] Standard Errors assume that the covariance matrix of the errors is correctly specified.
/home/jca92/drexel_runner_engineering/actions-runner/_work/_tool/Python/3.11.11/x64/lib/python3.11/site-packages/statsmodels/stats/stattools.py:74: ValueWarning: omni_normtest is not valid with less than 8 observations; 5 samples were given.
  warn("omni_normtest is not valid with less than 8 observations; %i "
🧹 8. Jupyter Notebooks: Interactive Programming Environment#
![]()
Who: For educators, researchers, and professionals presenting or documenting their workflows.
What: An open-source web application for creating and sharing live code, equations, visualizations, and narrative text.
Where: Used in teaching, collaborative projects, and exploratory research.
When: Ideal for demonstrating algorithms, visualizing data, and documenting results in one place.
Why: Combines code execution, markdown, and rich output in a single environment, streamlining workflows.
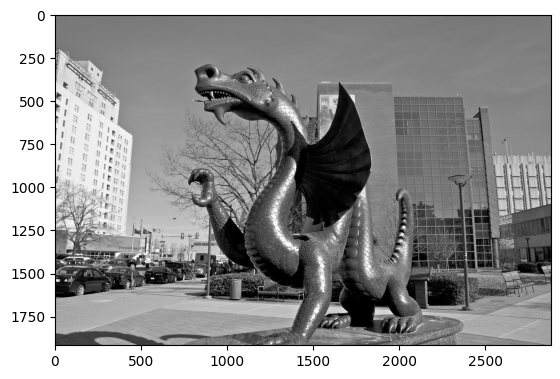
🔐 9. OpenCV/Scikit-Image: Computer Vision Library#
![]()
![]()
Who: For engineers working on image and video processing tasks.
What: A library offering real-time computer vision capabilities, including image filtering, object detection, and motion analysis.
Where: Applied in robotics, autonomous vehicles, and industrial quality control.
When: Necessary when analyzing or manipulating visual data for mathematical or engineering purposes.
Why: Provides fast and efficient algorithms for computer vision, leveraging modern hardware.
Example:
import cv2
import matplotlib.pyplot as plt

image = cv2.imread("./assets/figures/Mario_the_Magnificent.jpg", cv2.IMREAD_GRAYSCALE)
plt.imshow(image, cmap="gray")  # Use 'gray' colormap for grayscale images
plt.show()
plt.axis("off")  # Turn off axis
(np.float64(0.0), np.float64(1.0), np.float64(0.0), np.float64(1.0))

Additionally, there are many other specialized libraries that cater to nearly every domain of engineering and applied mathematics. All you need to do is a quick google search to find the right tool for your specific problem. If you can think of it as a mathematical or computational problem, chances are there is a Python library that can help you solve it!
By incorporating these tools into your Python workflow, you can solve a wide range of mathematical, computational, and engineering challenges effectively. They’re the ultimate essentials in the modern Python engineer’s toolbox!
While we do not have time to cover all these tools in detail, we encourage you to explore them further and integrate them into your projects. Each library offers unique capabilities that can enhance your problem-solving skills and computational efficiency. Happy coding! 🚀