
📝Importance of Data Analysis and Visualization ❗#
Why is Data Analysis One of Your Most Important Skills?#
In your remaining time at university and as part of your career, you will probably be asked to make data-driven conclusions.
A failure in any step of data analysis or visualization can result in bad decisions
Failures in Data Analysis#
Morton Thiokol Engineers on the Challenger#
Background#
On January 28, 1986 the Challenger Space Shuttle was set to launch

The shuttle had an orbiter, a large fuel tank, and two solid-rocket boosters.

In the solid rocket were joints held together by O-rings
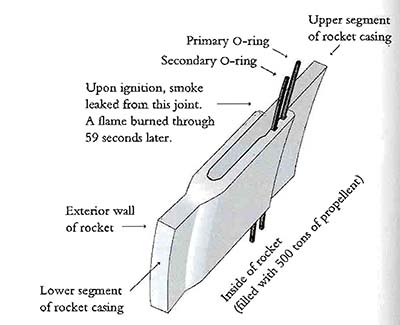
Close up of the O-ring assembly – a small leak could lead to a runaway explosion
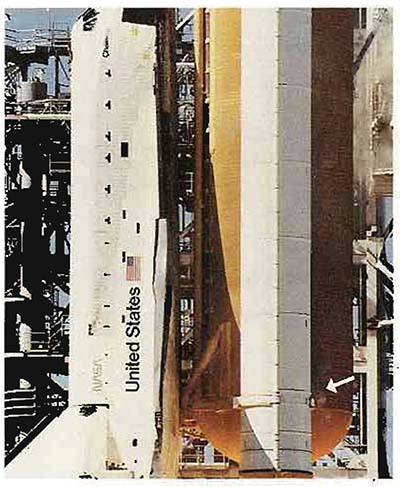
About 1 second after ignition a small puff of smoke was seen in the right booster indicating the o-ring had failed
On launch the area where the leak was could be seen burning for about 2 seconds and then was plugged by the melting material and insulation
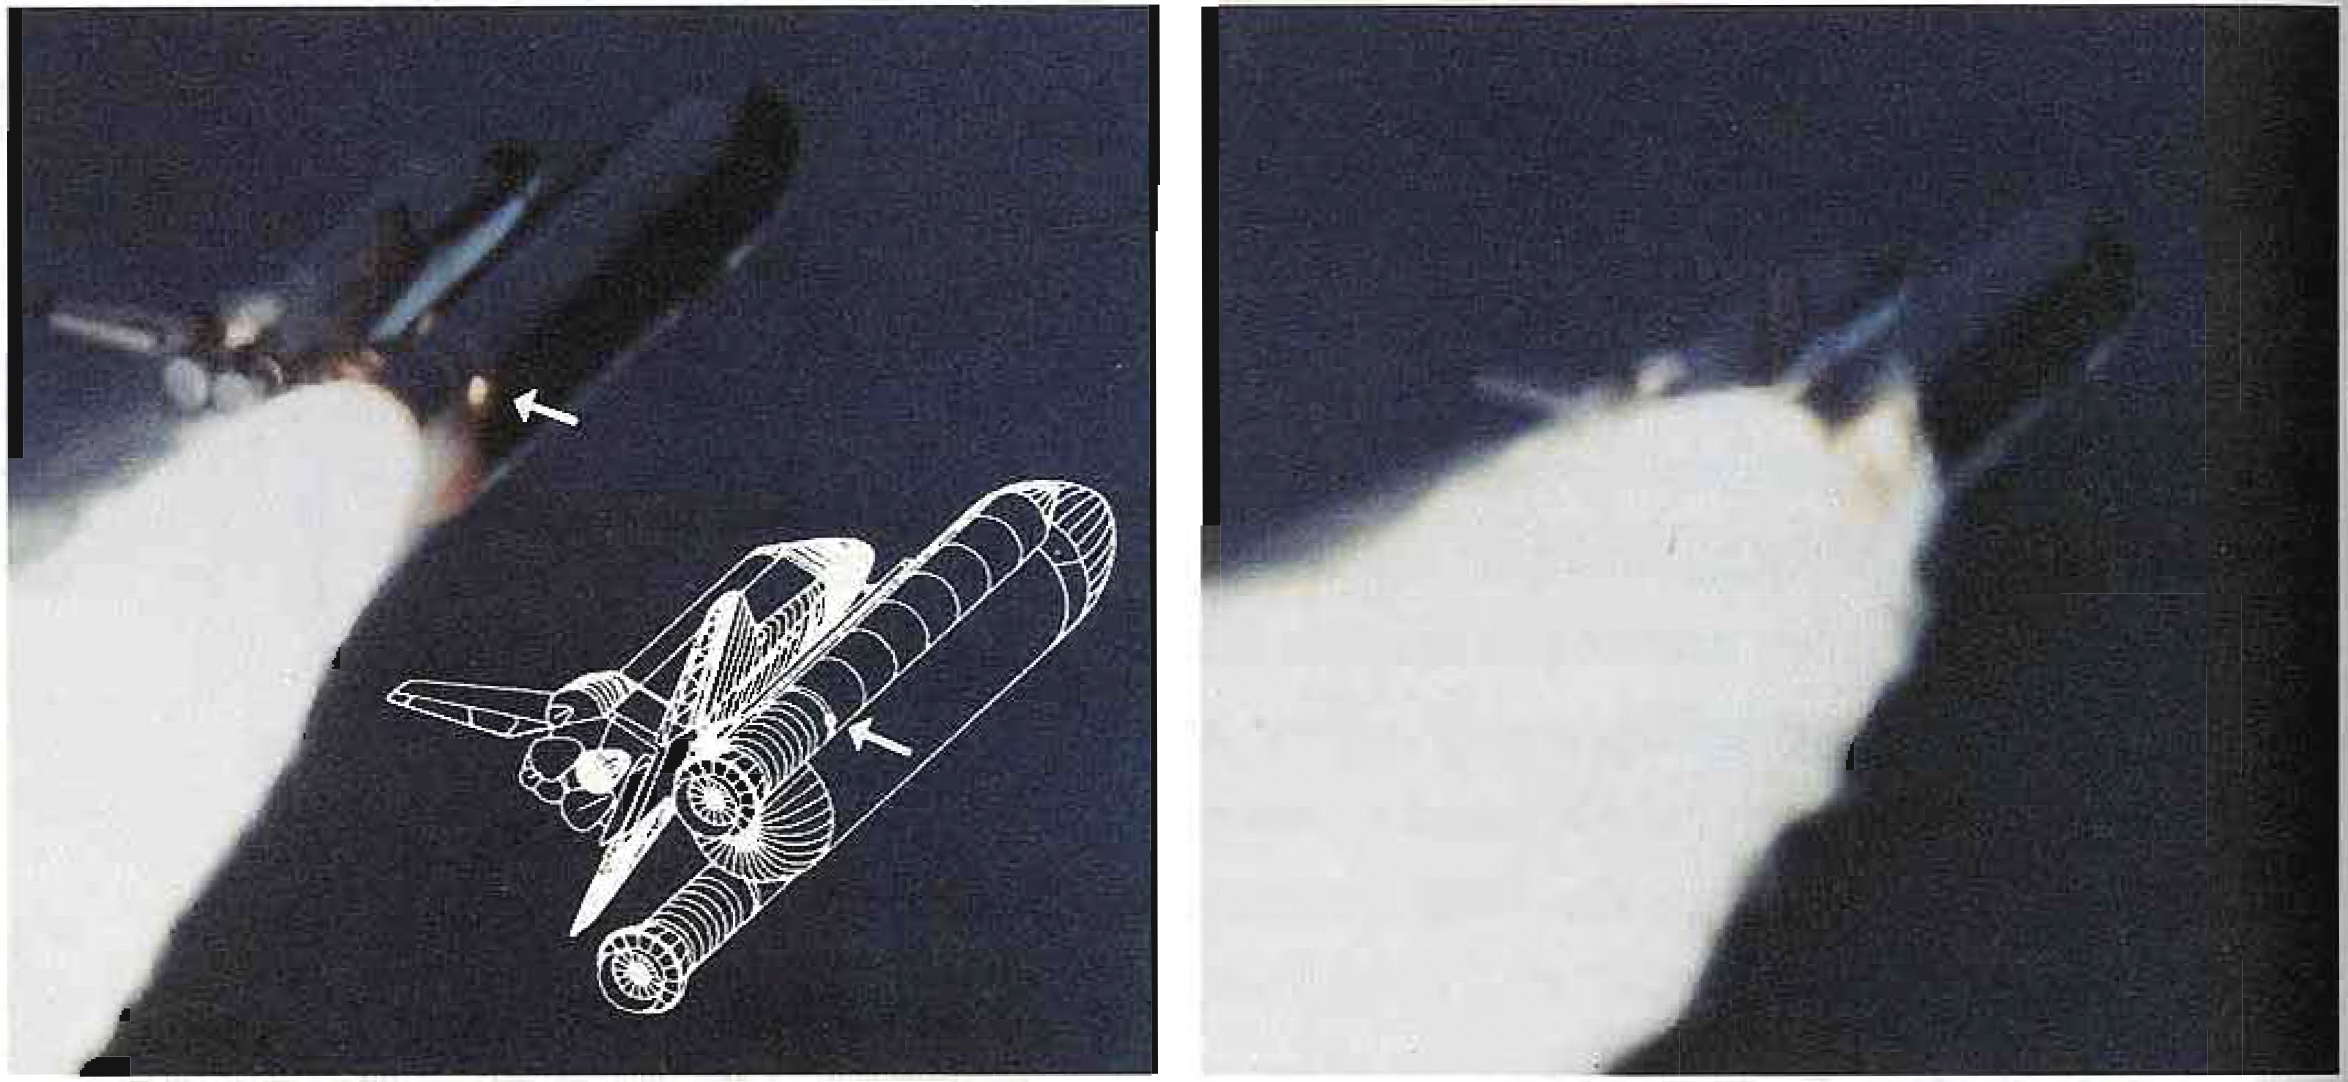
At ~58 seconds the small flame grew to engulf the right solid rocket booster

After 73 seconds the space ship exploded

All 7 crew members lost their lives
Why did this happen?#
Ambient temperatures were in the low 30s (\({}^{\circ}F\))
Engineers concerned that the o-ring would not seal at low temperatures prepared a document outlining their argument to postpone the launch to NASA
Data analysis provided by Morton Thiol tried to explain:
Past experience with low temperature launches
Physics of resiliency which declines exponentially with temperature
However, they did so with confusing and misleading representation of data
In industry and academia you will be required to present data to administrators and decision makers. These people will have to make difficult decisions and may have obfuscated goals. If you analyze and present data in a convincing way you can lead decision makers to make confident and correct decisions.
While various parties could be blamed, the crisis may have been averted if data were presented in an obvious and convincing manner
How the data were presented#
13 charts in a report and a discussion held via phone
Title of report#
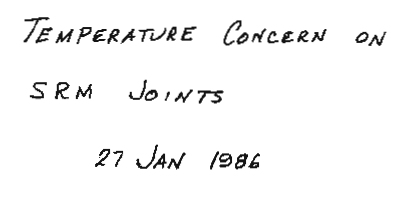
SRM joint? \(\rightarrow\) Solid-Rocket Motor
No authors listed
“Concern” probably does not convey how serious their conclusions were
First Figure - History#

Does not show any evidence of catastrophic damage
The chart provides no information about the cause determined by the engineers \(\rightarrow\) temperature
Damage is listed as a bunch of parameters \(\rightarrow\) some combined index is needed
Second Figure - Joint Bending#
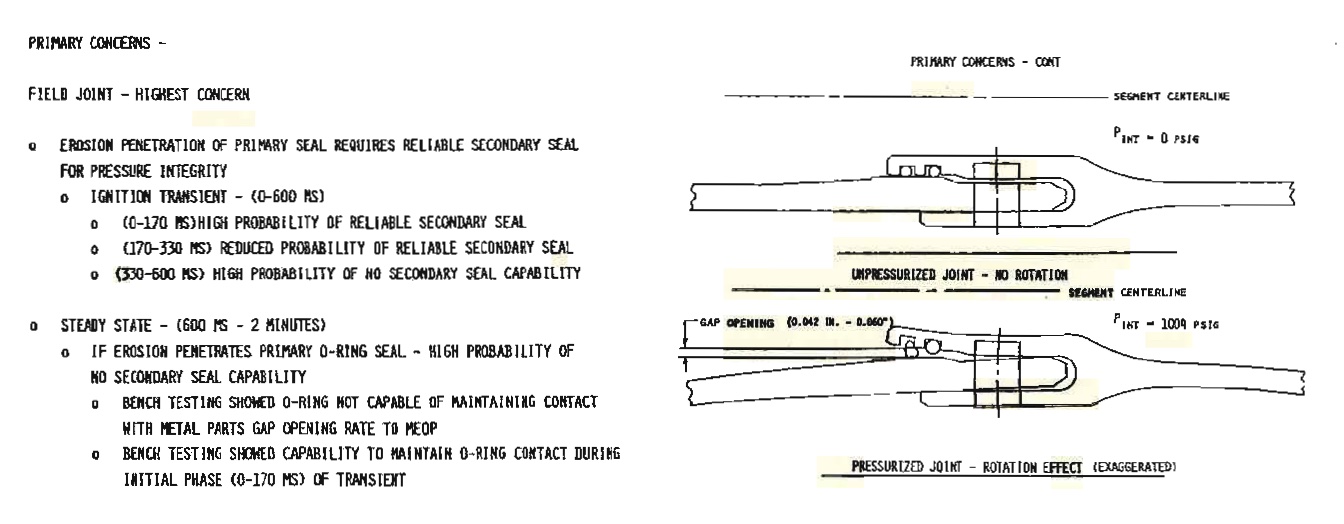
Shows the effect of how bending joint can cause a problem with the seal \(\rightarrow\) once again temperature is not mentioned

This table shows temperatures, but nothing about blow-by is indicated in table
This rocket launch is not clearly indicated
This does not show the other 22 launches of the SRM rocket, and their temperatures.
The development motors DM are extremely misleading. These rockets never left the ground and thus should not be expected to exhibit the same degree of blow-by.
Conclusions#

Conclusions drawn were not convincing based on evidence
Conclusion that o-ring temperature should be >53 \(^{\circ{}}F\) was based on a sample size of 1
There was no association made between the material properties and temperature. This would have highlighed that 53 \(^{\circ{}}F\) is significantly different than the expected launch temperatures of 29 \(^{\circ{}}F\)
How the data should have been presented#

If a mere ordered data table with some description was used it would have been clear that temperature and o-ring damage are strongly correlated
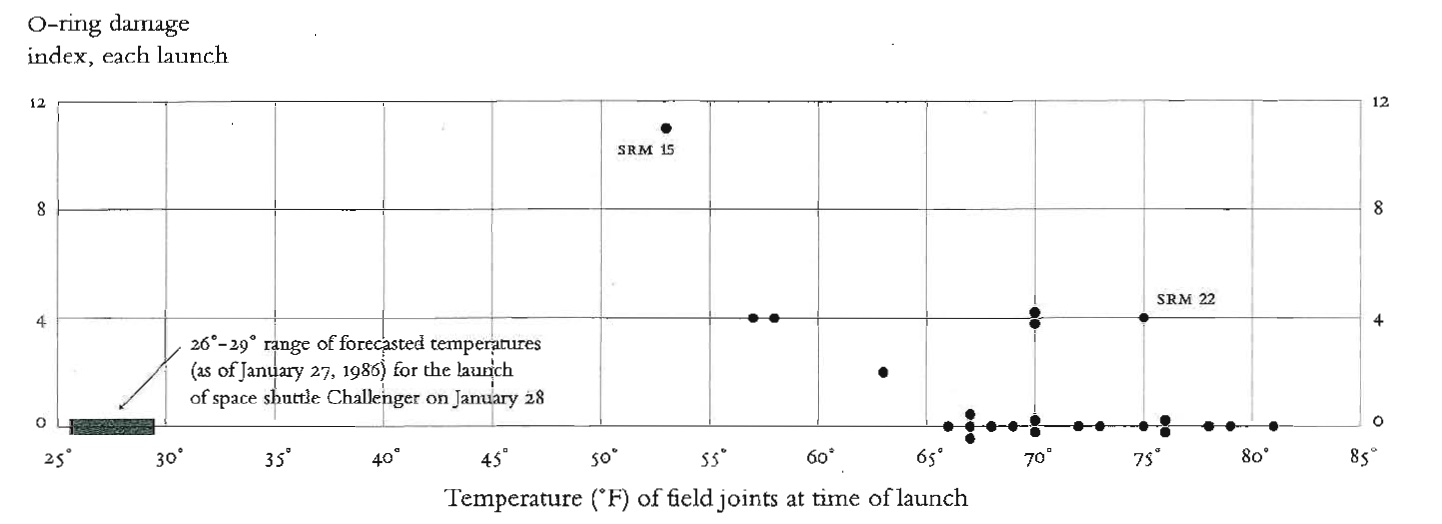
Even better a scatter plot showing the o-ring damage index and launch temperature would have made the argument not to launch very convincing
The post-mortem report#
The report they presented#
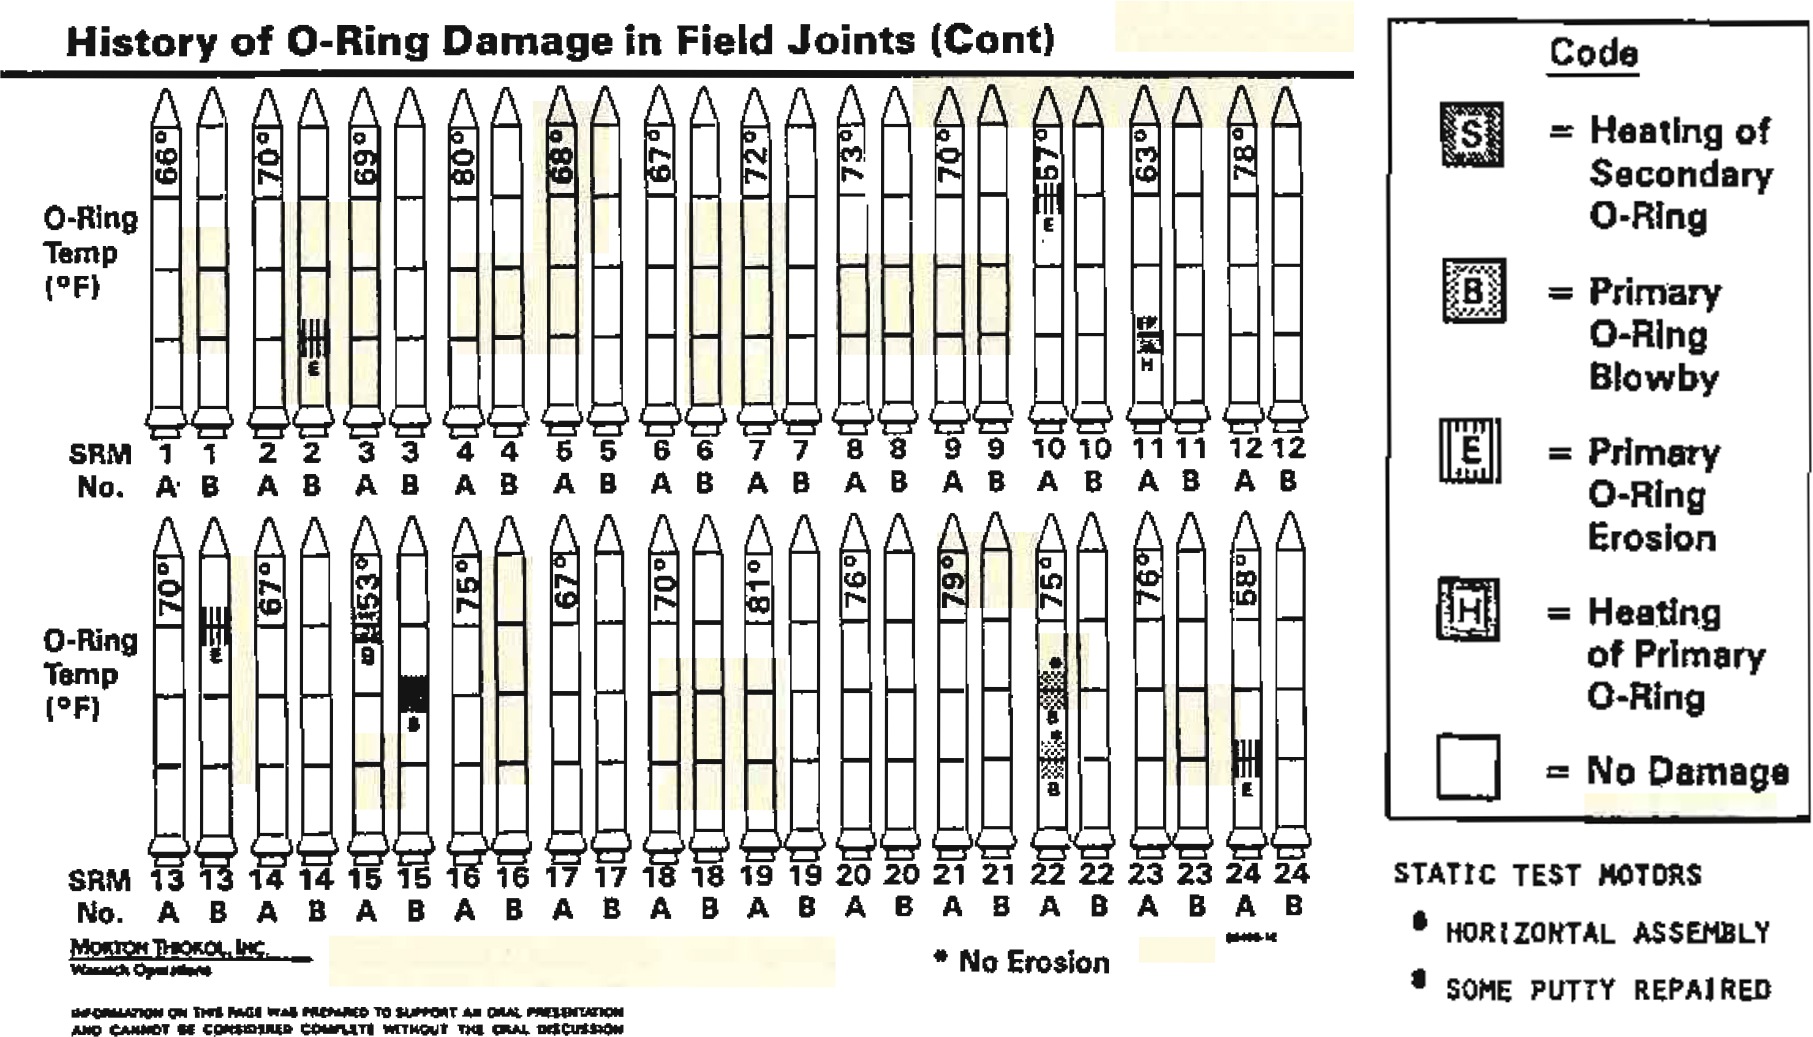
Even after the accident the data still was not presented clearly:
The order of the rockets is listed sequentially, not by temperature of the launch
Temperature is not able to be visualized graphically
Damage indication is very difficult to correlate to the temperature
Rockets are silly, unnecessary, and distracting
Also, they dropped the legend
A Slightly better but still bad report#

If they just ordered the rockets by temperature it would have been much more convincing
Richard Feynman Simply Explains the Day#

The best way to explain a complex concept is with a simple to understand experience
Show code cell source
from IPython.display import HTML

HTML(
    '<iframe width="800" height="450" src="https://www.youtube.com/embed/raMmRKGkGD4" title="YouTube video player" frameborder="0" allow="accelerometer; autoplay; clipboard-write; encrypted-media; gyroscope; picture-in-picture" allowfullscreen></iframe>'
)
/home/jca92/drexel_runner_engineering/actions-runner/_work/_tool/Python/3.11.11/x64/lib/python3.11/site-packages/IPython/core/display.py:475: UserWarning: Consider using IPython.display.IFrame instead
  warnings.warn("Consider using IPython.display.IFrame instead")
How you analyze and present data-driven arguments can have important real world impacts